Total quality management. What is a histogram and how to use it How a photo histogram should look like
Modern digital cameras have greatly facilitated the work of the photographer, making it more efficient, speeding up the process of obtaining a finished photograph hundreds of times. In fact, we immediately see an almost finished photo on the camera display. Another question is whether the quality of the photographs has grown from this ... But this is not the point here.
One of the ways to preliminary assess the quality of a photo is to analyze the histogram on the camera screen.
bar chart is a graph of the brightness distribution of the pixels in an image. The camera can display both the overall histogram of the composite RGB channel and the histograms of the individual channels, red, green, and blue. The horizontal axis is the brightness values of the pixels, from black to white, through intermediate gradations (for color channels, respectively, from black to the most saturated color). The vertical axis is the number of pixels corresponding to a certain brightness, expressed in relative units.
How to use the histogram
Let's look at examples of what information can be obtained from histogram analysis, and how you need to adjust the camera settings to get the best image quality. Indeed, in many articles there is a phrase "follow the histogram" or "orient yourself by the histogram". Let's figure out what, specifically, you need to follow and what to do with these "orientations" later.
Normally exposed photo


If the scene you are shooting has a wide enough range of brightness, then the histogram of a normally exposed image will look something like the one shown in the figure above. The histogram occupies the entire tonal range, while on the right, in the highlights area, it should not be cut off (there should be a small area). Although, in some cases, the histogram may be clipped. This happens when there are very bright light sources or glare in the frame. If the picture is normally exposed, no adjustments need to be made to the settings.
Important note: on the camera screen you see an image specially created for viewing, the so-called built-in thumbnail. It has already been processed by the camera processor, that is, the contrast has been raised, the gamma has been adjusted, etc. Thus, if you shoot inRAW, then you have some margin for highlights, that is, you can allow slight clipping (histogram cropping) in bright areas. With a subsequent decrease in exposure in the converter, the information will be restored, and the noise in the image will decrease slightly. This type of photography is calledETTR(exposureToTheright).
Photo with underexposure


Otherwise, this picture is called underexposed or underexposed.
In this case, the picture visually looks darker than it should actually be. At the same time, the histogram is cut off on the left, in the area of shadows, and an extended area is formed in the area of light tones. These are lost details in the shadows, an increase in the noise level when the image is lightened, the need for color correction. When shooting in RAW format, the situation is not so tragic, but the image quality will still be lower than if we used a shot with a normal exposure. Noise in the image will inevitably increase, therefore, it will be necessary to deal with them. And the fight against noise is always a compromise between noise and small details. There is no program yet that perfectly removes noise, while leaving the same detail as a picture with a lower ISO and normal exposure.
To get a normally exposed photo if the proof test is underexposed, do one or two of the following:
- Open the aperture by 1-2 (values are approximate, in each case they are determined individually) steps. In this case, you will get a shallower depth of field.
- If it is impossible to open the aperture, or it is necessary to maintain the depth of field, you can increase the exposure time by 1-2 steps. In this case, it should be borne in mind that moving objects may be blurred, or a "shake" effect may result due to hand trembling.
- If you need to keep the same depth of field and shutter speed, increase the ISO value by 1-2 stops. This will inevitably increase the noise level, however, it is better to get a sharp, clear picture with some noise than a blurry one with low noise.
A photograph overexposed.


Otherwise, this picture is called overexposed or overexposed.
In this case, visually the picture looks lighter than it should be in reality. At the same time, the histogram is cut off on the right, in the area of highlights, and in the area of shadows, on the left, an extended area is formed. If shooting is done in JPEG format, then the lost information cannot be recovered, that is, the details in the bright areas are lost forever. Sometimes overexposure is used as an artistic technique. If you are shooting in RAW format, then it is forgiving of small exposure errors (within 1-2 stops, depending on the camera model), but this is not a reason to continue to make mistakes when shooting. In the converter, such imaginary information losses are easily restored, while the image quality is somewhat improved (see above about the ETTR method).
To get a normally exposed shot if the test shot is overexposed, do one or two of the following:
- Close the aperture by 1-2 steps. In this case, you will get a greater depth of field.
- If a greater depth of field is undesirable (for example, you want to blur the background a lot), use a 1-2 stop decrease in the exposure time. The risk of getting a blurry picture, on the contrary, is reduced.
- You can also take advantage of reducing the ISO value by 1-2 stops if you are shooting at an ISO other than the minimum.
If you shoot on a bright sunny day with a fast lens wide open, you may not have enough shutter speed limit and ISO of your camera to get a picture with a normal exposure. In this case, it makes sense to use a neutral gray filter that attenuates the luminous flux.
Digital technologies make the work of a photographer much more efficient and faster. Today, digital cameras can not only show the result of shooting immediately on the camera display, but also analyze these photos - show overexposed areas of the frame and a histogram (general and separate for each of the three RGB channels).
The histogram allows the photographer to analyze the frame and make adjustments to the shot instantly. And thereby save you from unnecessary processing in the RAW converter and Photoshop.
is a graphical representation of the distribution of halftones in a photograph. The brightness scale goes horizontally, and the relative number of pixels with a given brightness goes vertically.
The histogram is read from left to right, from black to white.

Look at the following examples and you will understand how to read a histogram.
  The histogram shows that there are no completely black areas in the photo. On the right you can see that there are small overexposed areas in the photo. |
  The histogram as a whole is distributed evenly over the entire brightness range. There are small zones of over- and underlight, but they are not critical. |
The following example shows how to see under- and overexposure from the histogram.
  The display will not make it clear how white the background is. The histogram shows a complete dip on the laptop screen, light gray body tones and a white background around the object. The display will not make it clear how white the background is. The histogram shows a complete dip on the laptop screen, light gray body tones and a white background around the object. |
  Looking at the camera screen, it is difficult to understand whether there are losses on the body of the car. The histogram clearly shows that there are no absolutely black areas, but overexposure is clearly visible on white objects. Looking at the camera screen, it is difficult to understand whether there are losses on the body of the car. The histogram clearly shows that there are no absolutely black areas, but overexposure is clearly visible on white objects. |
The histogram also helps with processing in Photoshop in the Levels mode. See how the histogram and photo look after increasing the contrast.

  |
  |
| On the left is the original photo, on the right is the result after a slight increase in contrast. As you can see, the work of contrast stretches the histogram, adding dark and light areas. | |
Why do you need a histogram?
All modern cameras are equipped with sufficiently large and high-quality displays. Why do we need a histogram then?
Displays have their own level of brightness, the perception of which also depends on the ambient light. If you look at the display at night, the picture will seem very bright, and during the day, on the contrary, it will be very faded. Due to the fact that the histogram shows the image in the form of a graph, it is independent of any viewing conditions.
The quality of displays in cameras is really high, but not enough to show the difference between almost white and absolutely white, as well as the difference between almost black and absolutely black.
Look at the following photo:
 http://www.flickr.com/photos/bigfrank/368734607/

This is just the perfect photo for our situation. Of course it was processed in Photoshop, but it does not matter.
As you can see in the photo there are no overexposures or dark areas. The histogram shows us the same. There are not high bars along the edges, which indicate overexposure from lighting lamps and dark areas on the showcase. Otherwise, as you can see, the histogram shows that most of the information is in the midtones.
One glance at the histogram is enough to make sure that the exposure is correct and go on shooting.
As you already understood, each image has its own histogram, so there is no right or wrong histogram.
The histogram should be considered as a tool for quickly analyzing a photo during shooting (or during processing).
When to Use a Histogram
Night shooting
In the absence of external light sources, it is especially difficult to determine the brightness and contrast of a photo.
Studio photography
If you're shooting in a studio and don't have a light meter to measure the power of your fixtures, you have to work at random, adjusting your camera based on the result on the display. The histogram will more accurately show the situation in the picture.
Object shooting
Items are usually photographed against a white background. The photo can only show areas of overexposure. And the histogram will help you understand how white is really white.
Outcome
As you can see, the histogram is a very powerful and handy tool for a photographer. This is an absolute must for creating technically high-quality images. And in our next articles, we will continue to talk about interesting and effective tools for working with photos.
Article text updated: 2.08.2019
In both my previous Nikon D5100 cropped DSLR and the new Nikon D610 full-frame camera, viewing pictures on the rotary display by pressing the up button on the joystick, you can display an incomprehensible graph. For all three years of using the Nikon D5100 camera, I never dug deeply, did not understand the details of what information it provides. And only after switching to Nikon D610, I decided to figure out in detail what it is and why the manufacturer provided photographers with this function. It turned out that focusing on this diagram, it is easier to take a correctly exposed picture. I have previously noted that when I talk about my discoveries, it is easier for me to remember and digest new information myself. Therefore, today I present to your attention a new free photo tutorial for beginners - I share what I myself learned.
Histograms are found in almost every modern graphics editor. It seems to me that all modern cameras, including some soap dishes, can display a histogram on the screen. And the fact that these graphical tools are so common shows how important they are. But many aspiring photographers don't understand what information can be gained by reading a histogram. There is nothing wrong or shameful if this process seems too complicated at first. In fact, it is not so difficult to figure out what they mean. And today we will try to learn how to read histograms, and hopefully by the end of the lesson we will understand how they help photographers.
What is a histogram
A histogram is a graphical representation of the tonal values in our image. In other words, it shows the number of tones of a particular brightness in the photo from black (0% brightness) to white (100% brightness) range. As you can see in the picture above, the dark tones are grouped on the left side of the graph. If we move the slider to the right, the tones become lighter. The dot in the middle represents midtones that are neither dark nor light. The vertical axis of the histogram shows the number of tones of that particular brightness. The histogram is exposure dependent, although it is also affected by tone curves and other settings.
Highlights and dips in the shadows on the histogram
Photo 2. Above - clipping in the shadows, below - overexposures (clipping in the highlights). How to learn how to take pictures correctly. Photograph on how to learn to read a histogram.
If a certain amount of the histogram "touches" the border, this means a loss of detail, which is called "clipping". Overexposure (areas in the photo where the picture is completely white, the details have disappeared) happen if the histogram touches the right side. Underlights (areas where all the details are lost in blackness) appear if the histogram touches the left edge of the graph. Each of the options can occur if the exposure settings are not set correctly. Be that as it may, it must be borne in mind that a lot depends on the scene that we are shooting. For example, if there is a sun in the frame, then it will, of course, be completely white - highlights.
We know that overexposure and dips in the shadows, to a certain extent, can be successfully dealt with when post-processing RAW files in a graphics editor like Lightroom. If we want to check if there are “dropped out” areas in our photo, then we can do this right on the camera. For different cameras, the call of the histogram is performed differently.
Photo 3. View of the histogram on the screen of the Nikon D5100 camera. To show the graph, on the joystick I press the "Up" key, to hide - again.
For example, with Nikon DSLRs, you need to press the navigation key on the joystick several times. Many modern SLR cameras allow you to make exposure adjustments through real-time histogram control. True, for this you need to shoot in Live View, and not through the viewfinder.
For the very beginners, I note that in order to eliminate losses in the shadows, you need to enter the exposure compensation a little plus (EV +0.3 ... + 0.7) when shooting, and to darken the overexposure, reduce the EV by -0.3 ... -0.7 units. Usually the exposure is set by pressing the “+” and “-“ keys on the camera.
We know from the lesson on choosing the settings for Nikon and Canon cameras that another way to change the exposure, say, when shooting in manual "M" mode, is to set different values of ISO, shutter speed and aperture.
Color channels on the histogram
A histogram is commonly used to represent information about the three primary colors (red, green, and blue), which is called RGB. The figure above is an example.
As you can see, the RGB histogram consists of several graphs. Three of them represent red, green and blue respectively. Gray - places of superposition of all three histograms. Yellow, cyan, and magenta are areas where the two graphs overlap.
Histogram and Exposure
Histograms help display exposure graphically. Few photographers use a graph to judge exposure levels, usually only looking "bad" or "good".
A “good” histogram contains more information in the midtones, and either no or few tones at the edges. A "bad" histogram has tones at the edges of the graph, which basically means that the image is overexposed (lost highlight detail) or underexposed (lost shadow detail).
Sometimes it happens that in the photo there are both underexposures and overexposures at the same time. If we accept this statement, then the histogram at the beginning of the article says that the picture is slightly overexposed (tones shifted slightly to the right), but, in general, it is normal.
Let's test our theory in practice by examining the following shots. I made 3 of them with different exposures.
Underexposed photo
In the first shot, we see an example of an underexposed shot: the photo is too dark. As we can see, most of the photo has lost any neutral and bright details. The histogram clearly shows that all the tones are concentrated in its left part, which is responsible for the shadows, and some details are lost (in this area of the image there is a completely black image).
Overexposed photo
Photo 6. Overexposed photo - clipping on the histogram on the right.
In the second photo, we observe overexposure: the picture is too bright. Most of the tones are too light and there are practically no dark areas. A significant part of the image is “burned out” (completely white) and no details can be distinguished here. We can see that the histogram confirms this flaw in the image: the tones are concentrated on the right.
Let's take a look at the third picture. It is exposed correctly and most of the tones are concentrated in the center of the graph.
Correct exposure
Let's analyze this photo. As we can see, there are some tones on the far left side (black colors are displayed here), which means that there is no loss of detail in the shadows.
In the middle of the graph, everything is fine with us too. On the right, we see a peak of light tones - this is almost an illuminated area of the sky (in this photo, the histogram covered it).
Do we need to use a histogram?
As we saw in the examples above, a "good" histogram is one where the tones are concentrated in the middle. This fact indicates the correct exposure. Does this mean that the histogram can be used to judge the correct exposure? Not really.
Let's see another example with a histogram that is completely different from the "good" one presented earlier. This is a photo hunt for a polar bear in the snows of the Arctic.
As we can see, the histogram is shifted to the right where we have the highlights. If we judged the correct exposure of this particular shot based only on the shape of the graph, we might assume that the picture is overexposed. In the midtones we have almost no information, the shadows are almost brightened. But we can't say that the picture above is not properly exposed, can we? Do we need to change camera settings to get a "good" histogram, but one that makes the photo too dark?
Another example: you decide to shoot a Lenspen (lens cleaning pencil) against a black background in order to place the photo in the catalog of an online store.
We see that the graph is shifted to the left, there are almost no light tones. But the photo, after all, is normally exposed, there is no clipping of shadows?
A simple takeaway from this example is that a histogram is not necessarily a good indicator of exposure. "Correct" depends on many factors, not the least of which is our own vision of the scene we are photographing. The histogram simply shows us the number of tones of different degrees of brightness in our picture and nothing more. It can help us determine if there are highlights or underlights in a photo at a given exposure setting. We can use the histogram to avoid such loss in highlights or shadows, and it is a great tool for this. When we understand this, we realize that there are no "good" or "bad" histograms.
Conclusion to photography lesson on explaining the meaning of the histogram for beginner photographers
Some photographers have a habit of looking at the histogram on the camera screen after each shot to determine if there are areas in the photo that are lost in shadows or highlights. Although I, for one, don't always have the time to do this check. If we use a histogram, we don't become professional photographers, but being able to read it can, in some cases, be an invaluable skill. I hope this article will help us learn how to read and understand these graphs, apply the histogram in our work.
- (histogram) A diagram representing the distribution of a variable when there is information about its individual values. The areas on the diagram are proportional to the number of corresponding observations in each interval, for example, annual ... ... Economic dictionary
bar chart- (histogram) Graph of the frequency distribution, which is built using rectangles, whose area is proportional to the frequency of finding a given value in the interval on which this rectangle is built. Business. Dictionary. M .: INFRA M, ... ... Glossary of business terms
BAR CHART- (from the Greek. histos here a column and ... a gram) (bar chart), one of the types of graphical representation of the statistical distributions of any value according to a quantitative attribute. A histogram is a collection of adjacent ... ... Big Encyclopedic Dictionary
bar chart- a figure obtained on a plane where Cartesian coordinates are entered and grouped observations are plotted along the abscissa axis, and the number of corresponding observations is plotted along the ordinate axis. The upper part of the G. contour is a statistical analogue of density ... ... Geological Encyclopedia
bar chart- in technical analysis, an interval chart, on which each time interval is associated with a straight line segment (stick), the beginning and end of which are the highest and lowest prices of the period. At the same time, the opening and closing prices are marked on ... ... Financial vocabulary
bar chart- is a way of graphical representation of the distribution of numerical (continuous) data, often used in exploratory data analysis to illustrate the main characteristics of the distribution. The range of possible values of the variable is divided into segments, ... ... Dictionary of Sociological Statistics
bar chart- one way of graphical representation of quantitative data in the form of rectangular "columns" adjacent to each other and corresponding to the frequency of each data class. Dictionary of practical psychologist. Moscow: AST, Harvest. S. Yu. Golovin. 1998.… … Great Psychological Encyclopedia
bar chart- A graph consisting of vertical or horizontal bars whose height or width is proportional to the data values. histogram bar chart [Luginsky Ya. N. et al. English Russian dictionary of electrical engineering ... ... Technical Translator's Handbook
BAR CHART- HISTOGRAM, a bar chart whose columns represent the frequency (in absolute terms or percentage of the total) with which certain values (or ranges of values) occur within a certain data set. see also… … Scientific and technical encyclopedic dictionary
bar chart- noun, number of synonyms: 1 diagram (9) ASIS synonym dictionary. V.N. Trishin. 2013 ... Synonym dictionary
Books
- How to play and win on the stock exchange. Psychology. Technical analysis. Capital Control, Alexander Elder. An extended audio version of one of the most famous trading guides in the world, written by stock trading guru Alexander Elder. The preparation of the Russian text of the audiobook was carried out ... Buy an audiobook for 499 rubles
- Information. Perception and understanding, A. V. Antonov. The results of psychological experimental and theoretical studies of perception and understanding of pictographic (photo, drawing, diagram, pictogram) and ideographic (graph,…
Histograms make it possible to make a preliminary assessment of the distribution law of a random variable during quality control, i.e. understand how the values scatter, whether there are influencing factors and how they affect the measured result.
The histogram is a bar chart and allows you to visualize the nature of the distribution of a random variable
The construction of the histogram is as follows
1.
A research plan is created, measurements are taken, the results are entered in a table. The result can be either an actual measured value, such as a tightening torque of 20 Nm, or a deviation from the desired value, such as recording a deviation of 0.05 mm when evaluating the workpiece diameter.
Table 1 shows an example for 40 measurement results of the moment of force (N*m).
The specified moment of force is 25.5 N*m, deviations are ±1.5 N*m. It will be considered for plotting histograms.
Table 1.
2.
In the resulting sample, find the minimum and maximum values Xmin and Xmax(Table 2).
3.
Calculate the difference R=X max -X min(Table 2).
4.
The difference R is divided into z equal intervals (L), where z=√N, N- the volume of the entire sample (the number of measured values of the parameter) (Table 2). For an accurate analysis, the sample must be representative, i.e. be sufficient for analysis and its accurate interpretation. A representative sample is considered to be from 35 to 100 values, usually N=100. Interval length L=R/x must be greater than the division value of the scale of the measuring device with which the measurements were performed.
Table 2. 
5.
The frequencies of values falling into intervals are calculated, a distribution table is compiled and its graphical representation is constructed. At the same time, the frequencies of values that are on the border of the intervals are equally distributed between adjacent intervals (Fig. 1) 
Fig.1
Having a value distribution table X( arithmetic mean) and S2(standard deviation) can be calculated using the formulas 
Where x i is the average value of the i-th interval 
Or using the corresponding functions in MS Excel
AVERAGE() for X
STDEV.V() or STDEV.G() for S2
Knowing X and S2 it is possible to estimate the process reproducibility index ( C p), which will be discussed in another article.
Based on the histogram considered in the example, it can be concluded that some of the values are outside the tolerances and most of the values go towards two peaks on the left and right borders of the tolerances, which is typical for a sample that combines the results of two processes when two distributions are mixed with widely spaced averages. In this case, it is necessary to apply the stratification method and analyze again. In this case, it can be assumed that the measurements were carried out with two different keys, which gave such a result. Separating the data by different keys will eliminate double peaks in the histogram.
Thus, there are some basic types of histograms based on the graphical representation of which it is possible to draw conclusions about the nature of the population.
We also recommend
 How does a nuclear icebreaker
 Panasonic LUMIX DMC-FZ300 digital camera review and testing channel XLR audio input connectors
 Scenarios for Defender of the Fatherland Day ★ (February 23) Comic script for February 23 for boys
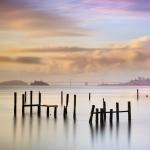 landscape photography landscape photography lessons
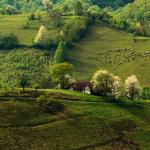 Composition and light in the landscape
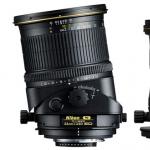 What is a tilt-shift lens and what is its scope?