We measure the economic effect of automating business processes. Methodology for calculating the economic efficiency of automation of production processes Economic effect of automation
3. Calculation of the economic effect from the implementation of the automated power supply management system KS-10
Since the thesis project examined in detail the development of an automated power supply control system (ASU-ES) KS-10, we will calculate the economic effect of introducing this system.
Brief description of the system being implemented
The developed ACS-ES system collects information about the state of electrical installations. The data enters the control room, is processed and provided in a form convenient for the operator. The dispatcher can constantly receive information about the status of the entire power supply system. The period for updating information on the workstation monitor does not exceed 1 s. The possibility of dispatch control (control of circuit breakers, emergency power plants) is also provided. Thus, in the event of an accident or abnormal operation of the power system, the dispatcher can quickly make decisions to eliminate the emergency situation by quickly switching to restore power to the disconnected equipment.
The purpose of creating an ACS-ES:
provide a high level of automation of control, management and protection;
increasing the reliability and efficiency of equipment operation, by optimizing technological processes, reducing the time of fault detection, through diagnostics and information about failures, reducing equipment downtime after emergency shutdowns and during repairs;
improving the working conditions and productivity of operating personnel by increasing awareness of the progress of technological processes and equipment operation, the quality of the formation and analysis of operational and archival documentation.
The automation objects are the central distribution substation (TsRP-10 kV), thirteen complete transformer substations 10/0.4 kV, seven emergency diesel power stations.
Calculation of one-time capital costs for the implementation of automated control systems
The cost of the system consists of the market price for automation software and hardware (HW), taken from the catalogs of manufacturing companies. Table 3.1 shows prices for equipment, the total cost is 1,565,884 rubles.
Transport costs are determined at 12% of the cost of software and hardware
| (3.1) |
where is the cost of software and hardware, rub.
Table 3.1 – List of software and hardware automation tools
| Name | Col. | Cost, rub. | Installation costs | |
| Direct costs, rub. | Remuneration of workers, rub. | |||
| 1 | 2 | 3 | 4 | 5 |
| TsRP | ||||
| Controller RTU-211 | 1 | 69310 | 4890 | 1630 |
| 1 | 2350 | 105 | 51 | |
| 42 | 1420 | 133 | 58 | |
| Optical distribution box 24 ports | 1 | 1100 | 280 | 112 |
| Interface cable RS-485 1m | 44 | 107 | 2 | 2 |
| Single-core optical cable, 2 m | 36 | 48 | 23 | 22 |
| 1 | 2 | 3 | 4 | 5 |
| Duplex optical cable, 10 m | 9 | 290 | 23 | 22 |
| Optical cable 24-core DPL-M-24, 0.2 km | 1 | 25950 | 35 | 34 |
| Transformer substations | ||||
| Controller RTU-211 | 13 | 73080 | 5043 | 1681 |
| Power supply PS1 =220/ =110 V | 13 | 2350 | 105 | 51 |
| Optoelectric converter SPA-ZC17 | 13 | 1420 | 133 | 58 |
| Optical distribution box 2 ports | 3 | 650 | 28 | 11 |
| Interface cable RS-485, 1m | 13 | 107 | 2 | 2 |
| Single-core optical cable DPL-M, 3.8 km | 1 | 103120 | 293 | 117 |
| Duplex optical cable DPL-M-2, 0.7 km | 1 | 28050 | 143 | 55 |
| Control room | ||||
| Uninterruptable power source | 1 | 8410 | 168 | 56 |
| Optoelectric converter SPA-ZC22 | 3 | 2240 | 148 | 59 |
| Optical distribution box 24 ports | 1 | 1100 | 280 | 112 |
| Duplex plug ST, 1m | 12 | 56 | 25 | 23 |
| RS-232 interface cable | 5 | 124 | 2 | 2 |
| Ethernet interface cable, 25m | 1 | 105 | 54 | 18 |
| Interface cable to GPS antenna RG58, 15m | 1 | 90 | 79 | 33 |
| Computer basic | 1 | 16500 | 2068 | 1176 |
| Relay engineer workstation | 1 | 17500 | 2079 | 1187 |
| Operator workstation | 1 | 17500 | 2079 | 1187 |
| Switch Super Stack 3 12-Port LAN Hub | 1 | 2090 | 110 | 44 |
| Print server | 1 | 8190 | 128 | 61 |
| RAD TinyBridge | 2 | 930 | 107 | 43 |
| GPS receiver 166 Meinbere | 1 | 9570 | 151 | 58 |
| MicroSCADA software package | 1 | 174000 | ||
| Total: | 1565 884 | 89 382 | 33 323 | |
The costs of installation work are determined for each element of the system according to SNiP, introduced in 2003, and are presented in Table 3.1.
Commissioning costs are determined according to the methodology given in the price list introduced in 1984, and are divided into stages shown in Table 3.2.
Table 3.2 – Calculation of the cost of commissioning work
Thus, the costs of installation and commissioning work will be determined as follows
where – direct costs for installation work, rub.;
– direct costs for commissioning, rub.; – index of changes in the estimated cost of installation and commissioning work in 1991 compared to prices in 1984; – index of changes in the estimated cost of installation and commissioning work in 2004 compared to prices in 1991.
where is the wages of workers for installation work, rubles;
– wages of workers for commissioning work, rub.;
– regional and northern coefficients.
Overhead costs are determined at 87% of the wages of installation and commissioning personnel:
Planned savings are determined by the formula
Table 3.3 presents a summary table for calculating capital investments.
Table 3.3 – Results of calculation of capital investments
Operating cost calculation
Since the developed system is built on the basis of microprocessor technology and is put into operation for 10 years, to maintain the system it is necessary to have only dispatch personnel, consisting of one electrical engineer, a relay engineer and a programmer engineer. Thus, operating costs will consist of the wage fund of three dispatchers.
The number of dispatch personnel in a continuous fishery is determined by the formula
where is the number of dispatch personnel present, people;
– conversion factor from turnout to payroll.
The calculation of the wage fund for dispatch personnel is determined by the formula
Where ![]() – average salary in the gas industry for 2004, rub. - unified social tax.
– average salary in the gas industry for 2004, rub. - unified social tax.
Depreciation charges for microprocessor equipment are determined at 10% of the cost of the equipment:
The cost of paying for electricity will be
where is the tariff for consumed electricity, rub. behind ;
– power consumed by the automated system hardware, kW;
h – number of hours per year, hours.
Following the recommendations of the book, we use the following method for calculating the economic effect. The effect is achieved by preventing damage to consumers through the use of automation tools and is determined by the formula:
where is the effect of reducing damage to consumers, rub.;
– one-time capital costs for automation equipment, rub.;
L – the number of years of use of the automated system, during which the system will bring economic benefits;
– operating costs, rub.
In formula (3.10), to determine the effect, we consider the main damage to consumers associated with power outages, as a result of which the enterprise incurs losses. The values of specific damage from undersupply of electricity are given. For the gas industry, translated into current year prices, this figure is 125 rubles. on . The book provides an assessment of the reliability of various power supply schemes for compressor stations. For the power supply circuit used at KS-10, the average downtime of the entire power supply system required to find and eliminate the cause of the failure is 30.1 hours per year. According to research carried out in the USA, the time to find and eliminate the cause of a power outage when using a centralized automated control system is reduced by 40%. Thus, to determine the average value, you can use the formula:
where is the specific damage to the enterprise from undersupply of electricity, rub/;
P – the value of the switched-off power, defined as the average power consumed by the electrical installations of the enterprise, kW;
– time by which the power supply interruption is reduced, hour.
In accordance with formula (3.9), the economic effect of using ACS-ES at CS-10 will be:
Table 3.4 shows the results of calculating the economic effect of introducing an automated system.
Table 3.4 – Results of calculating the economic effect from the introduction of an automated system
| Name | Formulas | Amount, rub. | |
| 1 | Capital investments including VAT | 2 516 834 | |
| 2 | Operating costs | 1 447 780 | |
| Including: | |||
| Payroll fund | 1 232 604 | ||
| Depreciation deductions | 156 588 | ||
| Electricity costs | 58 588 | ||
| 3 | Damage Prevention Effect |
| 3 178 368 |
| 4 | The effect of using ACS-ES |
| 1 478 904 |
It must be emphasized that the effect used in formula (3.10) takes into account the reduction of only one damage, namely damage from power supply interruptions, achieved through quick analysis and identification of emergency situations, while receiving timely and complete information for automatic or manual switching (with system prompts for operator).
In addition, the use of power supply automation provides a number of other implicit effects:
Thanks to automatic technical accounting, it becomes possible to rationally use electrical energy, as well as identify “invisible” losses and non-production expenses.
Dispatching the management of energy facilities using automated power supply systems saves consumed electricity through automatic control and proper planning of the maximum load.
The period 1995-2005 is one of the last places, second overall only to the traditionally problematic coal industry on average for the period. From this, at least, it does not follow that the vertical integration model ensures the balanced development of all segments of the oil business that make up the production and technological chain of vertically integrated oil companies. At the same time, in the cost per unit of production in oil production in...
60v batteries. The station is equipped with track circuits ~ I with a frequency of 25 Hz, with a DSSh-13A track relay, as well as point electric drives of the SP-6M type. 3.2 Arrangement of blocks according to the station plan. Type of blocks, their structure and purpose. Blocks at the BMRC are arranged on a stylized single-line plan of the station, which indicates: the numbering and specialization of receiving and departure tracks; numbering of hands...

The wage fund, but the sequence of work on organizing wages is usually the same for all enterprises. Development of new methods Sequence of work on organizing wages at the enterprise. Floating salary system. In this system, every time at the end of the month when work is completed and calculations are made...
reducing the profitability of gas stations (today, according to the experience of Western countries, more than 50% of income comes from this type of activity). In the next few years, the effect of monopolization and the general increase in consumption of petroleum products in Russia, associated with an increase in the vehicle fleet, will have a positive effect on the financial performance of oil companies given a favorable market situation on world stock markets.
The author of the article analyzes the history of development of the oil industry in Russia and reveals basic tendencies in oil-product retail. The statistical analyzes of the processes taking place in the industry is done. In the condusion the author makes his prognosis of the influence of changes in the industry to the financial indicators of oil companies.
UDC 65.011.56.003.12:656.2
V.N. Grishakov, graduate student, 8-910-168-64-24, [email protected],
(Russia, Moscow, MIIT)
ASSESSMENT OF THE EFFECTIVENESS OF AUTOMATION OF PRODUCTION PROCESSES IN THE STRUCTURE OF RAILWAY TRANSPORT
Automation of production is considered as one of the ways to increase efficiency. Taking into account the peculiarities of technological processes, methods for assessing the effectiveness of automation of production equipment are provided.
Keywords: automation, production process,
productivity, efficiency, economic indicators,
economic effects, mathematical apparatus, transportation process.
The introduction of new scientific and technical achievements into production from an economic point of view is one of the areas for increasing efficiency. Automation of production processes has the potential to improve efficiency beyond all previously used modernization and rationalization paths.
The main objectives of methods for assessing the effectiveness of production automation are to calculate the expected productivity gain and express it in economic indicators. Automation in many cases is accompanied by high one-time costs, which have a complex relationship with the actually achievable profit.
Economic evaluation of specific automation projects, aimed at identifying the relationship between costs and benefits, ultimately forms the basis for the development of production plans.
To assess the effectiveness of automation of production equipment, general universal principles are used, taking into account the characteristics of technological processes. From this point of view, two types of automation are considered: functionally integrated and functionally improving.
Functionally integrated automation covers the integrated part of the processes that perform control and stabilization tasks.
Functionally improving automation, optimizing production processes, allows you to increase equipment productivity. Automation efficiency assessment is carried out in the following sequence:
1. Setting performance improvement indicators
The economic goals of the automation measures being developed, for example, increasing reliability, increasing production volume, saving labor, should be indicated in the appropriate indicators. It is necessary to analyze the initial state of the production equipment to be automated in order to indicate in the task the initial level for comparison when assessing efficiency growth.
2. Consideration of possible automation options
Researching options is necessary to find the most
an effective solution that allows you to solve the assigned tasks with the least expenditure of material and living labor. At the same time, it should be possible to directly compare the options.
3. Calculation of one-time and current costs, as well as the expected economic gain for each option
To obtain a comprehensive assessment of the effectiveness of automation measures, costs and benefits must be considered not only for automated production equipment. The cost of equipment located in the warehouse, as well as those sent to the warehouse or off-site, should be taken into account. In many cases, the results are more significant than when taking into account only automated equipment.
4. Assessing the effectiveness of each option and choosing an automation method. The automation method is selected based on the principle of the best profit-cost ratio, i.e., achieving the greatest efficiency.
5. Assessing the performance of the task to improve efficiency for the selected option
In case of failure to complete the task, the work necessary to move closer to the intended goal can be determined.
Functionally integrated automation is organically inseparable from the functioning of production equipment and therefore
in most cases does not make a directly measurable contribution to improved efficiency. To evaluate the cost-effectiveness of functionally integrated automation, metrics using the resulting product categories are needed. Existing quality criteria do not fully take into account the purpose of automation and the guaranteed adequacy of production equipment to the functions performed.
Each option is judged on its quality, with performance and reliability being the defining quality indicators. Because with functionally integrated automation, equipment performance, or achievable production capacity, remains constant, the effectiveness of automation can be economically assessed by considering the reliability of equipment operation over a given time interval. The statistical characteristics of downtime depend on the reliability of automation devices, which, in turn, are related to the economic efficiency of processes occurring in production equipment. Since there is no direct mathematical relationship between reliability in a certain sense and economic effects, it is possible to use indirect indicators, such as “the number of failures in the planning period” and “the duration of individual failures.” They allow, based on payments for element failures, to calculate the functional efficiency of complex systems and the most acceptable failure statistics for the enterprise. Based on the fact that reliability ultimately determines performance, an extensive factor, i.e., a change in useful production time, can be taken as an evaluation criterion.
As a result, economic losses caused by reduced reliability are reflected in failure costs. They cause increased costs and decreased profits due to functional downtime of devices. Failure costs consist of three indicators. Two of them, namely the indicator of downtime costs (k8), i.e., for non-use of production equipment, and the indicator of costs for returning to production (k!), i.e., for starting production equipment after downtime, should be assessed taking into account equipment features.
The indicator of financial losses for each hour of downtime (Ku) is calculated in the form of a compensation payment using the formula:
Ku = (E - K From - Ke)1 TV,
where E is revenue in the planning year; Cat - annual cost of basic materials; Ke is the annual cost of energy; TV - annual production costs.
The annual failure costs (CA) are further obtained from the expression:
Ka = + kg) N a + Ku * Ta,
where Ka is the number of downtimes per year; TA - downtime per year.
The effectiveness of one-time costs for functionally integrated automation measures that increase equipment reliability can be expressed explicitly through failure costs. There is equality:
Ka = Ka ~ Ka ~ K + = N+,
where KA is the reduction in failure costs; KA, K"A - costs of failures before and after the implementation of measures that increase reliability (Ka > K"a); K+
Additional running costs.
The change in failure costs in this case constitutes profit K+. Comparing it with one-time costs for increasing reliability makes it possible to calculate the corresponding indicators for assessing the effectiveness of automation.
Functionally improving automation is based on the economic objectives of increasing the efficiency of the corresponding production equipment. Its economic effects are manifested both in the equipment itself and in the materials and energy used, labor and production management.
The economic effects associated with the equipment are expressed in a reduction in time costs (was ^ now ^). The resulting annual production profit is calculated using the formula:
E] = O/ 1Х - 1r0)ТвР,
where TV is the period of operation (year); P is the cost of a technical unit.
By reducing wear and tear costs, reducing the cost of maintaining equipment in good condition and technically caused downtime, a relatively constant part of the costs is divided into a larger number of equipment, so that the unit cost of each unit is reduced and profits increase.
In the energy field, the greatest effect is achieved by saving costs on technological processes, i.e. in saving energy, fuel and fuel for maintenance and elimination of equipment failures.
The annual savings will be
E 2 = E tT /=1
where t\ is the saving of materials per unit of time; Q\i - volume of volume
serviced devices after automation; ( = 1,..., n - current variable denoting different types of materials and energy.
The effects associated with labor are quantitatively manifested in a decrease in the cost of living labor per unit, since the automation of technology leads to labor savings. It should, however, be taken into account that if, on the one hand, savings are possible by reducing the number of service personnel, then, on the other hand, there is a need for operators to service automation devices, which also leads to higher wages, so the effect is wage savings are low. It manifests itself primarily due to the number of devices serviced due to the use of freed-up labor in production.
Savings amount to
E s = AK _[TSL +1) + i ],
where AK is the number of released employees; b is the labor cost factor for each employee per year; g is additional labor costs per year; b - contributions to public funds.
The use of automation means improves the operational properties of equipment, while the quantitative assessment of profit is determined by the translation of the achieved higher quality into a higher price.
In this case
where p+ is the increase in equipment cost.
The use of automation also leads to an increase in equipment reliability, which results in economic effects due to savings in repair and warranty costs.
To assess the effectiveness of production automation, first of all, it is necessary to highlight the profit due to automation by subtracting additional costs from the calculated final increment in profit. Such as depreciation charges for automation equipment, energy costs, wages of additional maintenance personnel maintaining good condition.
Estimated indicators include: payback period for one-time costs
where A is one-time costs for automation equipment; N is the additional annual profit due to automation measures.
The payback period shows how many years it takes to pay off the one-time costs of automation measures due to the profit caused by them.
Turnover of one-time costs
where 1 is a variable indicating the year of operation.
This indicator takes into account the total operating time of automation equipment and expresses how many times one-time costs are turned around.
The return on capital assets of production equipment improved by automation should increase. If we proceed from the need for a general improvement in the condition of fixed assets compared to their technical condition before automation, then it is:
O + N OP + Ae O + N
AK -AK_1 AK -AK~ OR + Ae"
The value of r increases only if the main automation condition is met - the profitability of labor grows faster than the cost of fixed assets.
Based on the above, it is possible to summarize the economic effects of automation tools and present them in the form of a summary table.
Automation of production equipment serves to increase its efficiency. To assess the effectiveness of equipment automation, various effects associated with automation are considered, systematized and economically evaluated. The mathematical apparatus proposed in the article serves these purposes.
The development of software and hardware systems for monitoring and administering communication networks (CMA), built on the basis of equipment from the MiniCom BX-500 family, makes it possible to concentrate the control and management of geographically distributed operational-technological communication systems at one or several operator workplaces. At the same time, a visual display of the current state and load of communication equipment distributed over tens and hundreds of kilometers is provided.
Economic effects of functionally improving automation
Effects Consequences
Cost effects Financial, economic, investment. Non-recurring Current: Costs for depreciation, wages, energy, materials, maintenance, taxes.
Effective effects One-time: Release of tools, reduction of spare parts and materials inventories. Ongoing: Equipment related effects, performance enhancements. Increased reliability Reduced wear Reduced working capital.
Increasing profits. Reduced unit costs.
Reducing failure costs.
Reduced repair costs.
Effects related to materials and energy Saving materials Saving energy Reducing material costs.
Reduced energy, fuel and fuel costs
Labor-related effects Direct labor savings Reduced wage costs, reduced contributions to public funds, reduced salary-based overhead costs, increased profits due to the use of freed-up labor.
Effects associated with the formation of processes Increasing production safety and reducing risk Expanding knowledge about the interconnection of processes Refining production instructions Improving the ability to process data about processes Positive impact on all components of the result.
The operator has complete information about all processes occurring in the system, up-to-date information about the real state of the communication system. Suffice it to say that on a site consisting of 31 Mini-Com BX-500 stations, about 5,600 control points are monitored. The combination of convenience and functionality of the workplace achieved during the development allows the operator to simultaneously monitor both the state of the communication system as a whole and the technical condition of individual sections and stations with an accuracy of an individual board and even its components using a hierarchy.
chemical system of screen forms. The operator can not only see which of the system subscribers may be affected by a collision that has arisen in the equipment, but also identify those technical devices whose incorrect operation may cause failures.
Failures, in turn, can cause an increase in operating costs of the transportation process due to:
Deterioration of train traffic;
Train delays;
Possible need to provide “windows”.
All this, in turn, causes a decrease in cargo turnover and cargo flow and leads to the risk of loss of profit.
Also, timely identification of the possibility of damage is the prevention of failure of expensive equipment, the repair of which is often comparable in cost to a new installation, and the reduction of indirect costs associated with eliminating the failure.
The tools for statistical analysis and visual display of accumulated information built into the automated control system make it possible to identify unstable system components and take measures to prevent failures before they can have a negative impact on providing users with reliable and uninterrupted communications.
The practical application of administrative analytical centers on the country's railways has led to a significant increase in the efficiency of management of departmental communication networks while reducing operating costs and costs associated with production activities.
Bibliography
1. Biles W.E. In: Simulation Modeiing Workshop / W.E. Biles. New York, 2006. V. 1. P. 25-28.
2. Mezhov I.S. Organizational design of integrated production systems / I.S. Mezhov. Barnaul, 2002.
3. Adaptation of industrial enterprises to scientific and technical innovations / ed. Doctor of Economics Sciences V.M. Goncharova. Kyiv: Tekhnika, 2008.
4. Unger B.W. Simulation. 2007. V. 30. No. 1. P. 32-37.
Grishakov Victor Nikolaevich
ESTIMATION OF EFFICIENCY OF AUTOMATION OF PRODUCTIONS IN STRUCTURE OF THE RAILWAY TRANSPORTATION
Automation of manufacture, as one of the ways of increase of efficiency is examined. In view of features of technological processes, methods of an estimation of efficiency of automation of the industrial equipment are resulting.
One of the main criteria for the feasibility of automating technological processes is economic efficiency. The economic efficiency of automation is determined by the reduction in total current and capital costs for the production of a unit of output. When automating agricultural processes, capital costs typically increase slightly, while operating costs per unit of output are significantly reduced. In other words, capital costs increase to a lesser extent than operating costs decrease. Thus, the effectiveness of automation is characterized by a reduction in the cost of producing a unit of product.
The economic efficiency of automation is formed from four components: energy, labor, structural and technological.
The energy component is determined by reducing fuel or energy consumption, increasing the reliability and durability of power equipment, the efficiency of energy supply systems, increasing the efficiency of power plants, etc.
The labor component is associated with a reduction in the direct labor costs of service personnel to perform technical tasks. By automating the process, labor costs are significantly reduced. At the same time, there is a slight increase in capital costs for its technical support.
The structural component is due to a reduction in regulatory and reserve capacities, a reduction in office space and utilities, a reduction in metal consumption and equipment costs, an increase in the amount of products obtained per unit area or the volume of industrial buildings, and an increase in the concentration of buildings on the territory.
The technological component is due to an increase in agricultural production due to automation of technological processes.
Calculation of the main indicators of economic efficiency of process automation
As a result of technical, economic, socio-economic and qualitative comparisons of automated and non-automated production methods, the main indicators of the economic efficiency of automation are determined: capital costs, annual operating costs, profitability, payback period, etc.
K=Ks+Km+Kz+Ko-Kr
where Ks is the cost of automation equipment, taking into account their delivery, installation and commissioning, rub.; Km - costs for modernization of existing equipment and technology related to automation, rub.; Кз - cost of construction and reconstruction of buildings in connection with the introduction of automation, rub.; Ko - the cost of fixed assets subject to liquidation when introducing automation devices, rubles; Kr - cost of the sold part of liquidated fixed assets, rub.
Annual operating costs are usually calculated as follows:
I=Io+It+Iz+Ie
where Io - depreciation charges, rub.; It - deductions for current repairs, rub.; From - wage costs, rub.; Ie - cost of electricity, rub.
Payback period for capital expenditures on automation at the same annual production volume
T=(Ka-Kn)/(In-Ia)
where Kn, Ka are capital costs, respectively, for manual and automated production: Kn? Ka, r.
Determine the economic efficiency of automating the egg collection process if capital costs for manual control (not automated) amounted to 92,000 rubles. Capital costs for automation equipment RUB 15,300. It is necessary to calculate the payback period for additional capital investments.
Initial data for calculation:
Depreciation rate: 14.2%;
Current repair costs 18%;
Tariff rate: 58.4 rub/hour;
Service rate: 3 people.
Staff working hours: 8 hours.
Equipment operating time per day: 8 hours.
Energy savings with the introduction of automation equipment amounted to 5%.
I=Iam+Itr+Iz.pl.+Iel
Pl.=number of workers*tariff.*hours of work*days of work
Iel=P*working hours/day*number of days*tariff
Manual control:
Iam=14.2*92000/100=13064 RUR
It.r.=18*92000/100=16744 rub.
Iz.pl.=3*58.4*8*120=168192 RUR
Iel.=105*8*120*2.28=229824 RUR
In=13064+16744+168192+229824=427824 RUR
Automatic control:
Iam=14.2*107300/100=15236.6 RUR
It.r.=18*107300/100=19314rub
Iz.pl.=2*60*8*120=115200 RUR
Iel.= 229824-11491.2*6/100=218332.8 RUR
Ia=15236.6 +19314+218332.8+15906.8=268790.2 rub
T=(Ka-Kn)/(In-Ia)=(107300-92000)/(427824-268790.2)=15300/159034=0.01 years
Conclusion: Due to the low cost of automatic devices, the installation pays for itself almost immediately.
The effectiveness of various stages of automation is assessed using the same criteria given above. At the same time, the general conditions for carrying out calculations remain the same:
Selecting a source base depending on the task at hand;
Bringing the compared options into a comparable form for all indicators-signs, except for the sign, the effectiveness of which is determined;
Determination of initial data based on data from already mastered production with stable parameters.
Despite the uniform methodology, when determining the economic efficiency of implementing various automation tools, their features are taken into account. For example, when assessing the efficiency of submarines, it is necessary to take into account their downtime by type and the impact of downtime on operating costs. When calculating the effectiveness of PR implementation, they take into account an increase in the rhythm of production, an increase in the equipment shift ratio, an increase in the stability of product quality, an improvement in working conditions and a reduction in injuries to workers. When assessing the efficiency of CNC machines, they take into account the reduction of losses from equipment changeover and from tying up working capital in work in progress. When calculating the economic efficiency of combining CNC and PR machines into robotic complexes, they take into account an increase in the shift ratio of main and auxiliary equipment, a reduction in investments in working capital and the number of service personnel, a reduction in all types of downtime, including for changeover, due to the rational organization and management of production using automated process control systems of automated process control systems.
Determining individual components of technological cost requires a more complete account of actual operating conditions and, above all, equipment load.
Before starting the organizational and technological design of the APS, the conditions for the economic feasibility of developing the project are determined:
where K o. base - capital costs for equipment in the basic version; to uv.st- coefficient of permissible increase in the cost of APS.
Data for determination to uvst are given in table. 2.9.
The main factors influencing the economic efficiency of AM are: composition, cost and productivity of equipment, degree of equipment utilization, degree of automation of production and management, range of parts, concentration of operations, quantity and cost of equipment, number of workers, composition of production and maintenance personnel, continuity of production , stability of output parameters, timing of production development, equipment adjustment.
When calculating the effectiveness of an automated system of a higher organizational level, consisting of individual automated systems (modules, lines, sections), it is recommended to determine the effectiveness of each component of the system and summarize the results obtained.
In a market economy, economic (production) categories are replaced by commercial (financial) ones, which aims to reduce the economic justification of new technology, in particular automated equipment, to profitability (profitability) indicators. Under these conditions, calculations of the economic efficiency of the implemented APS are based not so much on the reduction of current production costs (cost) and various amounts of one-time costs (TO), how much is based on profit, no matter how it (profit) arises (both in the sphere of production and - especially - in the sphere of circulation). This makes it possible in the financial system to summarize (compare) payments and receipts regardless of their sources, although, strictly speaking, the economy does not allow the pure addition of current expenses with one-time costs.

Thus, in the market calculation of the absolute efficiency of capital investments (payments), the invested amounts are compared with the receipts received not only by reducing the cost of production, over a certain period of time, until the amount of payments is compensated by the amount of receipts. The only thing that is taken into account is discounting revenues, as well as (when calculating the comparative financial efficiency of investments) alternative options, or costs of lost opportunities (the effectiveness of investments and payments that failed or were rejected when comparing options). The following methods are most often used to calculate the efficiency of new technology.
Many managers believe that automation of internal business processes- theoretically, it’s a useful thing, but it’s too expensive, and it’s still unknown whether these expenses will pay off. They will pay off handsomely!
One of the main reasons why projects automation internal business processes often pass with great difficulty or are not supported at all by top management and shareholders - this is the difficulty of calculating metrics (that is, numerical, not qualitative indicators) characterizing the economic effect of automation. This is because internal business processes, which include budgeting, management accounting and control, and reporting according to international standards, do not have a direct impact on the financial result. In comparison, the financial impact of automating customer-facing business processes is more obvious. For example, the implementation of CRM allows you to increase the number of clients, which can be quite easily converted into direct income.
But the difficulty of measuring an effect is not the same as its absence. In principle, none of the managers denies the generally positive effect of automating internal business processes. What is questionable, first of all, is the significance of this effect and its comparability with the cost of the project, or more precisely, with TCO (Total Cost of Ownership).
About the balanced scorecard system described Norton, Kaplan and others like them, a lot has been said and a lot is said. But I, nevertheless, dare to express my opinion. From my point of view, this system is not something abstract and theoretical, but only a formalization and structuring of what exists in the very nature of any commercial enterprise. Based on the works of financial and economic gurus and the accumulated positive experience confirming theoretical calculations, we can state the following with fairly high reliability:
Fair costs for automation, which made it possible to achieve correctly set goals in terms of internal business processes, will certainly have a positive impact on financial results in the medium and long term.
Many build the IT strategy of their enterprises based on these premises. By normalizing costs, for example, as a percentage of their own funds, they regularly increase their IT assets. With this approach, you only need to set priorities, control the quality and timing of implementation. And this is perhaps one of the most correct IT strategies. Yes, on the website IT-value.ru research data are presented Erik Brynjolfsson, confirming the correlation between the increase in the volume of IT assets and the volume of activity (revenue) of companies, albeit with a time lag.
At this point we could end our discussion of metrics and propose to consider the effectiveness of implementing automation systems for internal business processes through the achievement of quality goals. But, I’m afraid, the above approach has not significantly increased the number of people who want to refuse to measure the economic effect in monetary terms. So, we still need to somehow solve the problem that is the inverse of the main philosophical law (the transition from quantity to quality), and convert quality into quantity.
Despite everything, statistics is an exact science, although based on certain assumptions. In the process of thinking about approaches to assessing the economic efficiency of projects to implement IT solutions, I came to the conclusion that the method of expert assessments can become the very tool with which this problem can be solved. This completely scientific method of the empirical class (that is, based on experiments, observations, measurements, surveys, etc.) is used to form the necessary statistical mass.
I looked through quite a lot of articles and materials until I finally got acquainted with the work Douglas Hubbard, How to Measure Anything.Estimation of the value of intangibles in business", first published in 2007. Hubbard introduces the concept of Applied Information Economics as a set of modified statistical methods that allow obtaining quantitative economic estimates under conditions of uncertainty. Respect for the approaches proposed by the author is due to his more than twenty years of practice and worldwide fame as a practicing consultant.
- intangible phenomena and factors that seem absolutely immeasurable can be measured;
- the human brain is not just a computing machine, it is a complex system that cognizes the environment and adapts to it by developing a variety of simplifying rules;
- the decisive measurement tool is expert judgment;
- when the uncertainty of the assessment is high, the opinion of even several experts is sufficient to significantly reduce this uncertainty;
- measuring a part can give us fairly adequate information about the whole.
Having a fairly wide range of respondents in the banking sector at the level of managers and specialists of departments involved in budgeting, management accounting, IFRS, etc., we decided to conduct a survey in order to assess how much, in percentage terms, in the opinion of these experts, the efficiency of their work will increase when implementing an automation system for relevant business processes.
It is interesting that Douglas Hubbard, in his work, gives a similar example, in which the feasibility of introducing an electronic document management system is assessed through a seemingly abstract assessment of the increase in the productivity of engineers. We also decided to formulate the question this way and not otherwise (for example, directly: how much less time will you spend on completing the current volume of tasks?). Including because many perceive this question as “How much less will I be needed?”
The fears of the above specialists about their uselessness are practically groundless. Has anyone heard of layoffs being made after implementing some kind of automation system? Personally, I don’t. Another thing is that employees begin to devote more attention and time to the subject rather than to routine. Employees are ready to take on new tasks and assume new responsibilities. There is no need to irrationally increase the number of departments involved in internal business processes. The competencies and value of employees, on the one hand, are growing, and on the other hand, the dependence on individuals who are the sole bearers of knowledge and technology is decreasing. However, in order to reduce assessment bias due to this very fear, we made the wording of the question more abstract, but also more capacious.
We explained to our respondents that by increasing efficiency we mean reducing the volume or eliminating routine work, increasing the speed of problem solving, reducing the level of technical errors and increasing the reliability of the results obtained, the ability to use special numerical methods, etc.
We focused primarily on medium and small banks from the top 500 banks by asset size. About 40 specialists and managers from 30 banks took part in our survey. Having processed the data, we received a very encouraging result for us. According to the majority of respondents we surveyed, the efficiency of their work will increase by 30% or more, or, in statistical terms, the median value lies in the range of 30% and above.
Here we make the first serious assumption, believing that an increase in abstractly defined efficiency is associated, first of all, with a potential reduction in labor costs of departments that support internal business processes.
To estimate the full cost of employees participating in an automated business process, you need to multiply the value of the wage fund (payroll) for these employees by the overhead coefficient, which is usually taken equal to 2. Taking a percentage of the amount received equal to the estimate of the increase in efficiency, we will receive the expected amount of monthly savings and can consider it as an influx of cash in our investment IT project. Several scenarios can be considered. For optimistic, take the emergence of a positive economic effect a year after putting the automation system into commercial operation, for realistic - two years, for pessimistic - three years.
Let's look at an example. Let the monthly payroll of employees involved in organizing and supporting budgeting processes be 300 thousand rubles. The total cost will be about 600 thousand rubles. Savings per year, based on a 30% increase in efficiency, will amount to 2160 thousand rubles. Then, over five years from the end of implementation, the positive financial effect in this part for a realistic scenario can be estimated at 6,480 thousand rubles, without taking into account cash flow discounting. Of course, this effect does not materialize in the form of an account balance or cash register, but it objectively appears in the form of financial potential that can be used for development.
For a more complete assessment, using a similar approach, it is also necessary to evaluate the positive effect from the point of view of earning departments and top management. Evaluating the effect here can be approached in different ways. It can be proposed to evaluate how much, from the point of view of department heads and top management, the profitability of departments and business lines will increase, based on the fact that they will have more objective information for making management decisions, less time spent on internal routine processes, etc. . We can propose an integrated approach: assess the reduction in routine labor costs, similar to the case described above, plus calculate the positive effect in terms of income.
I would like to draw your attention to the fact that, despite its relative simplicity, this approach requires a certain amount of knowledge in the field of statistical methods, as well as some skills in obtaining statistical data or, more simply, skills in organizing and conducting surveys. This is necessary, first of all, to reduce the likelihood of the so-called “bias” of expert assessments, under the influence of external factors and due to incorrect processing of statistical data. An example of the influence of external factors or conditions for collecting assessments is a survey on attitudes towards soft drinks. With a high probability, a survey conducted in winter will be biased towards fans of hot drinks, and in summer - towards lovers of something cool. A properly organized survey will be conducted throughout the year.
To assess the economic effect of implementing automation systems for internal business processes in a bank, you can use our statistics, which are quite representative.
To obtain this kind of assessment, you can conduct a survey of experts within the organization. It is possible and necessary to work with small samples, but, I repeat, it is necessary to carry out certain activities taking into account the limited number of experts and other factors.
So, we have proposed an approach for assessing the economic effect of implementing automation systems for internal business processes. This approach allows you to significantly reduce uncertainty and obtain well-founded figures, which can serve as a good guideline when deciding on the advisability of automating the processes of budgeting, management accounting and control, etc., and as a result, reduce the risk of unjustified investments.
We also recommend
 How to get compensation or a new job if you are laid off
 Encyclopedic Dictionary F
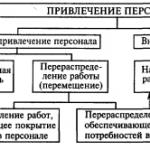 Ways to attract staff to work
 How to change the terms of an employment contract at the initiative of the employer Tk change of essential working conditions
 Job description of a leading document management specialist Interaction with other structural divisions of the company
 Research project "reward in our house"